Фазовая диаграмма системы H-Mn
К оглавлению: Другие диаграммы (Others phase diargams)
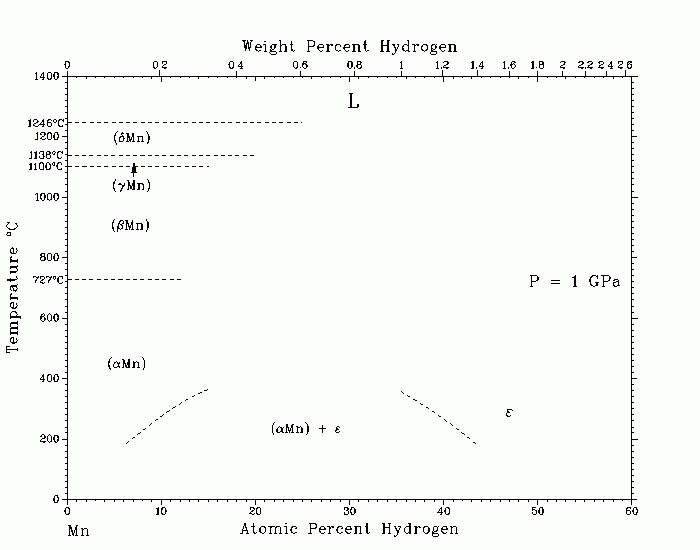
H-Mn (Hydrogen-Manganese) A. San-Martin and F.D. Manchester No complete phase diagram for the Mn-H system was found in the literature available through 1988. Only temperature-composition diagrams representing the maximum H solubility in solid and liquid Mn, mostly at atmospheric pressure were available. The assessed diagram is illustrated at a pressure of 1 GPa (10 kbar) and consists of the interstitial solid solution of H in aMn or (aMn) and an e phase with hexagonal structure and nominal MnH stoichiometry. The e phase was prepared by [75Kru] by holding Mn samples at 304 C for 3 days, in hydrogen, at a pressure of 14 MPa. The (aMn)/(aMn) + e and the (aMn) + e/e boundaries are delineated by dashed lines passing through composition values determined from the experimental isotherms of [79Bar]. In the isotherm diagram, the pairs of X values at which isotherms enter and leave the two-phase region are 0.097 and 0.681 at 227 C, and 0.124 and 0.635 at 304 C, respectively. This diagram also shows plateau lines (of undetermined length), traced at the formation pressure of the e phase for the stated temperatures. These pressures were determined by [76Kru] from electrical resistance measurements. The P and T values (P = 2.8 GPa, T = 350 C), used by [87Som] to synthesize the e phase (X = 0.95), were incorporated in the isotherm diagram to serve as a guide to eyeing the stoichiometric composition. Based on the complex polymorphic nature of Mn, [76Kru] considered that under high pressure, regions of the phase diagram corresponding to additional phases of Mn-H may be expected at high temperatures. The maximum solubility in solid (Mn) occurs at temperatures close to the melting temperature and did not exceed 0.22 at.% H, whereas the composition for the liquid phase (just above the melting point) amounted to 0.3 at.% H. The d = g, g = b, and b = a transitions are marked by solubility jumps and also display hysteresis effects [77Sil] controlled by diffusion kinetics. Below 500 C [37Sie], the solubility in (aMn) increases again. This unusual behavior remains unexplained. The high chemical reactivity of Mn should be considered. In effect, an ever present manganese oxide layer on the surface of the sample may distort the H absorption up to temperatures at which some of these manganese oxides dissolve. The formation of manganese hydroxide, for instance, is a possibility. [82Ser] avoided the formation of cracks on the spherical Mn samples by cooling slowly (~4 x 10⁻² C/s) the Mn spheres molded at temperatures of 1240 C (i.e., in the d phase). [82Ser] also used values of 1087 and 732 C for the g <259> b and the b <259> a transition at X = 0, different from the accepted values of 1100 and 727 C [89Gok], respectively. At hydrogen pressures higher than atmospheric pressure, the H solubility at room temperature increases. Thus, at a pressure of 1 GPa, it follows that at temperatures of 200 and 300 C, the terminal solid solubility increases up to values of 0.072 and 0.122 (6.7 and 10.9 at.% H, respectively.) 37Sie: A. Sieverts and H. Moritz, Z. Phys. Chem. A, 180, 249-263 (1937) in German. 45Pot: E.V. Potter and R.W. Huber, Phys. Rev., 68, 24-29 (1945). 75Kru: M. Krukowski and B. Baranowski, Rocz. Chem., 49, 1183-1185 (1975). 75Pon: E.G. Ponyatovskii and I.T. Belash, Dokl. Akad. Nauk SSSR, 224, 607-608 ( 1975) in Russian; TR: Dokl. Chem., 224, 570-571 (1975). 76Kru: M. Krukowski and B. Baranowski, J. Less-Common Met., 49, 385-398 (1976). 77Sil: J.R. G. da Silva and R. McLellan, J. Less-Common Met., 27, 101-104 ( 1977). 79Bar: B. Baranowski, Z. Phys. Chem. Neue Folge, 114, 59-81 (1979). 82Ser: H.P. Serdyuk and B.I. Shapovalov, Izv. V.V.Z., Chernaya Metall., (8), 70-74 (1982) in Russian. 87Som: V.A. Somenkov, V.P. Glazkov, A.V. Irodova, and S.Sh. Shilstein, J. Less- Common Met., 129, 171-180 (1987). 89Gok: N.A. Gokcen, Bull. Alloy Phase Diagrams, 10(4), 313 (1989). Submitted to the APD Program. Complete evaluation contains 5 figures, 4 tables, and 25 references. 1